This report compares the inference performance of two GPU systems running local LLM models using Ollama. The benchmark tests were conducted using the llm-tester tool with concurrent requests set to 1, simulating single-user workload scenarios.
Test Configuration
Systems Tested
-
- Host: bosgame.localnet
- ROCm: Custom installation in home directory
- Memory: 32 GB unified memory
- VRAM: 96 GB
-
- Host: rig.localnet
- ROCm: System default installation
- Memory: 96 GB
- VRAM: 24 GB
Models Tested
- deepseek-r1:1.5b - Small reasoning model (1.1 GB)
- qwen3:latest - Latest Qwen 3 model (1.1 GB)
Test Methodology
- Benchmark Tool: llm-tester (https://github.com/Laszlobeer/llm-tester)
- Concurrent Requests: 1 (single-user simulation)
- Tasks per Model: 5 diverse prompts
- Timeout: 180 seconds per task
- Backend: Ollama API (http://localhost:11434)
Performance Results
deepseek-r1:1.5b Performance
| System | Avg Tokens/s | Avg Latency | Total Time | Performance Ratio |
|---|---|---|---|---|
| AMD RX 7900 | 197.01 | 6.54s | 32.72s | 1.78x faster |
| Max+ 395 | 110.52 | 21.51s | 107.53s | baseline |
Detailed Results - AMD RX 7900:
- Task 1: 196.88 tokens/s, Latency: 9.81s
- Task 2: 185.87 tokens/s, Latency: 17.60s
- Task 3: 200.72 tokens/s, Latency: 1.97s
- Task 4: 200.89 tokens/s, Latency: 1.76s
- Task 5: 200.70 tokens/s, Latency: 1.57s
Detailed Results - Max+ 395:
- Task 1: 111.78 tokens/s, Latency: 13.38s
- Task 2: 93.81 tokens/s, Latency: 82.23s
- Task 3: 115.97 tokens/s, Latency: 3.83s
- Task 4: 114.72 tokens/s, Latency: 4.52s
- Task 5: 116.34 tokens/s, Latency: 3.57s
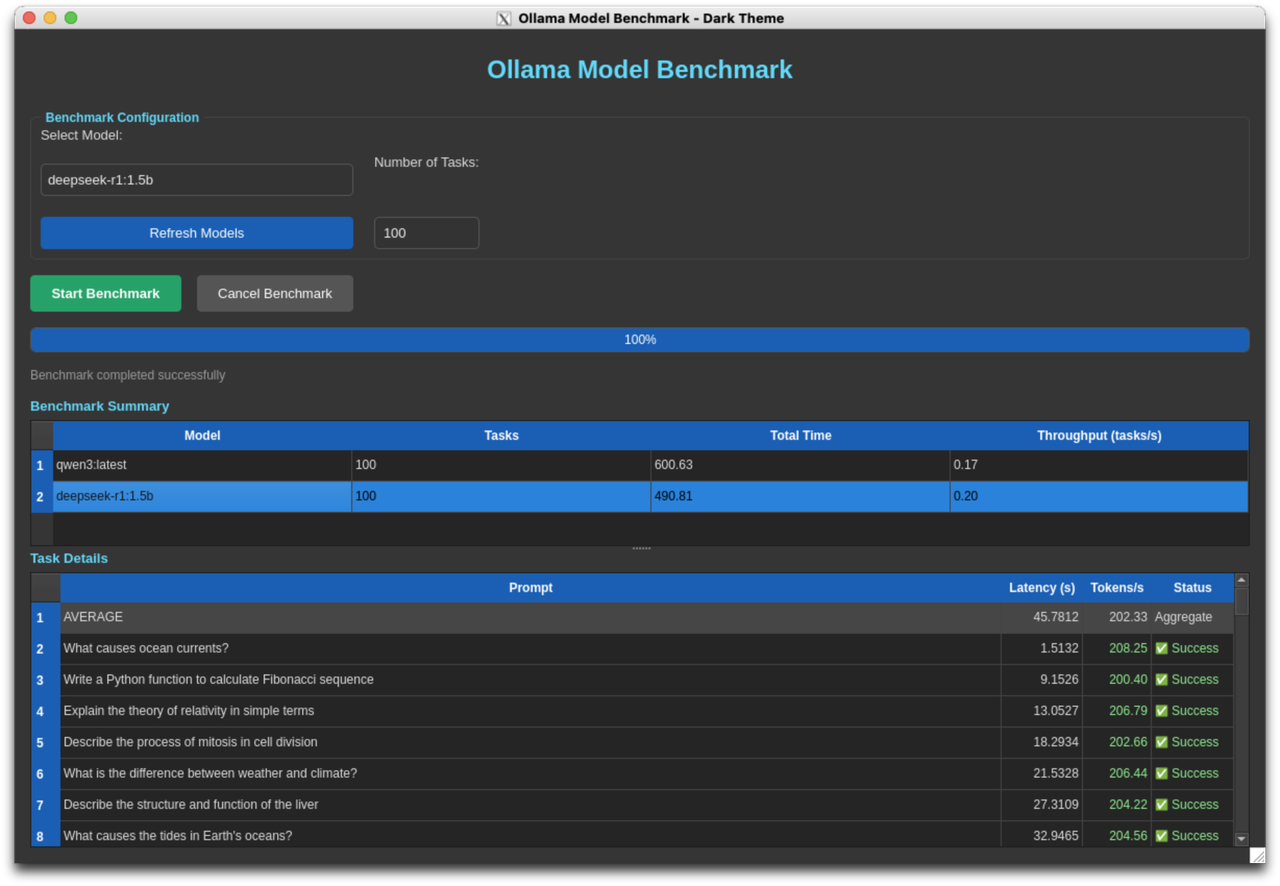
AMD RX 7900 XTX performance on deepseek-r1:1.5b model
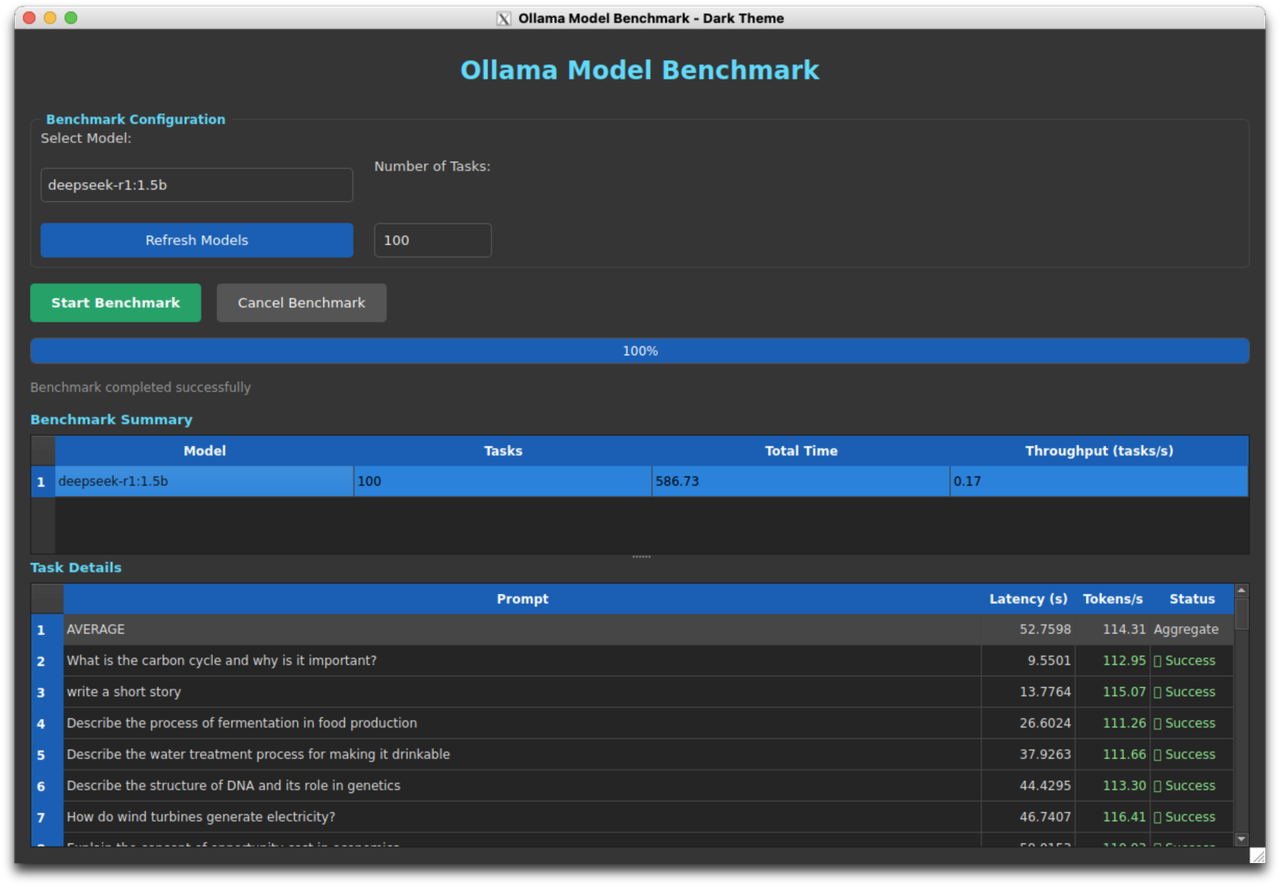
Max+ 395 performance on deepseek-r1:1.5b model
qwen3:latest Performance
| System | Avg Tokens/s | Avg Latency | Total Time | Performance Ratio |
|---|---|---|---|---|
| AMD RX 7900 | 86.46 | 12.81s | 64.04s | 2.71x faster |
| Max+ 395 | 31.85 | 41.00s | 204.98s | baseline |
Detailed Results - AMD RX 7900:
- Task 1: 86.56 tokens/s, Latency: 15.07s
- Task 2: 85.69 tokens/s, Latency: 18.37s
- Task 3: 86.74 tokens/s, Latency: 7.15s
- Task 4: 87.91 tokens/s, Latency: 1.56s
- Task 5: 85.43 tokens/s, Latency: 21.90s
Detailed Results - Max+ 395:
- Task 1: 32.21 tokens/s, Latency: 33.15s
- Task 2: 27.53 tokens/s, Latency: 104.82s
- Task 3: 33.47 tokens/s, Latency: 16.79s
- Task 4: 34.96 tokens/s, Latency: 4.64s
- Task 5: 31.08 tokens/s, Latency: 45.59s
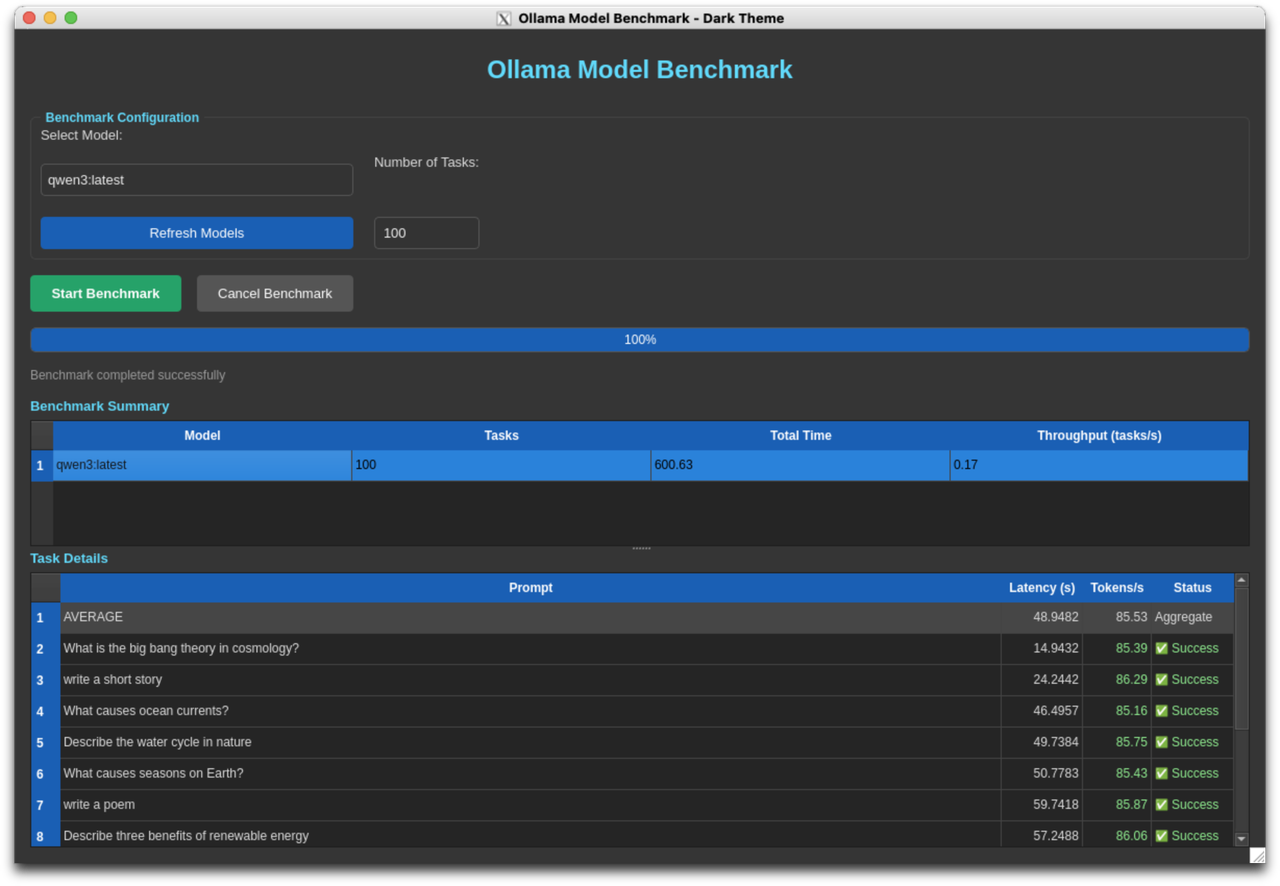
AMD RX 7900 XTX performance on qwen3:latest model
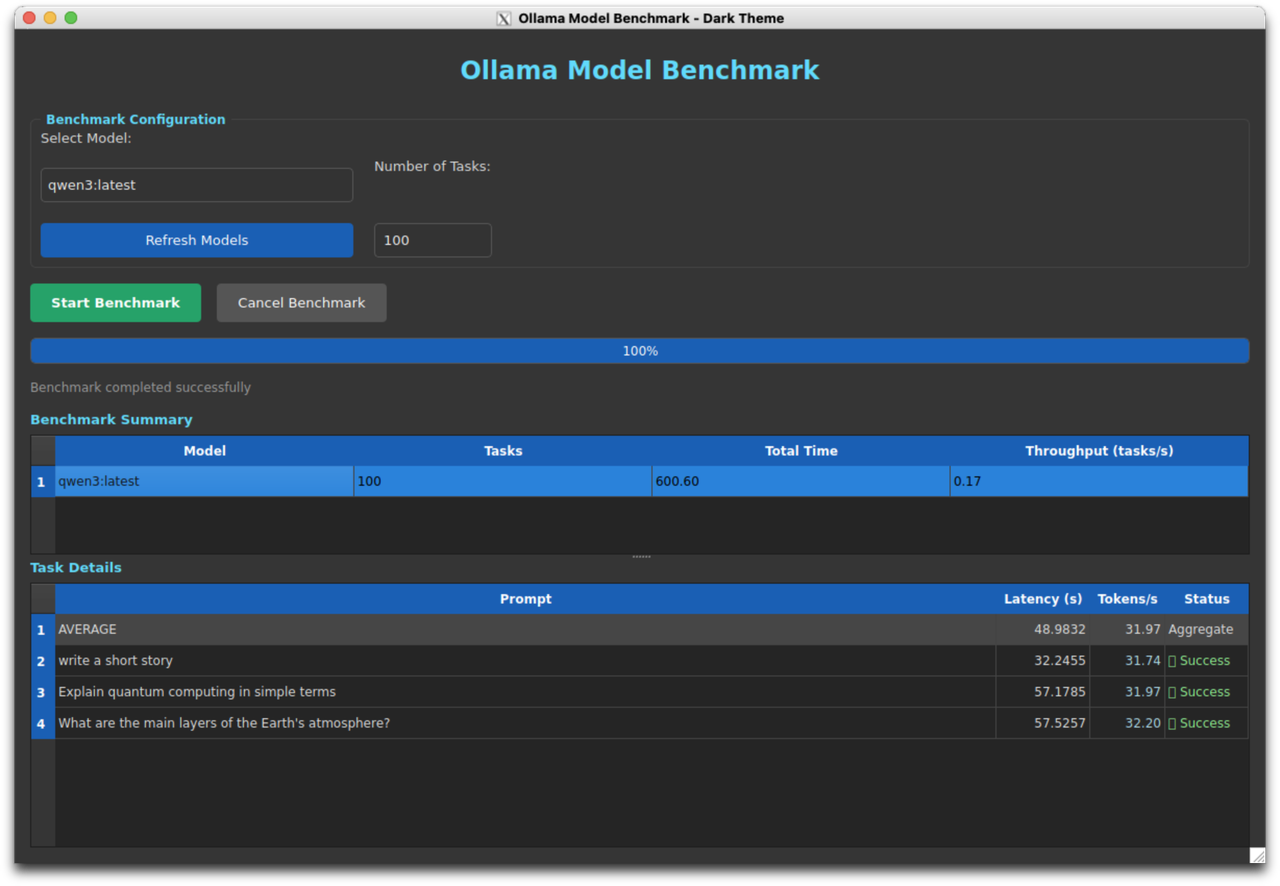
Max+ 395 performance on qwen3:latest model
Comparative Analysis
Overall Performance Summary
| Model | RX 7900 | Max+ 395 | Performance Multiplier |
|---|---|---|---|
| deepseek-r1:1.5b | 197.01 tok/s | 110.52 tok/s | 1.78x |
| qwen3:latest | 86.46 tok/s | 31.85 tok/s | 2.71x |
Key Findings
- RX 7900 Dominance: The AMD RX 7900 significantly outperforms the Max+ 395 across both models
- 78% faster on deepseek-r1:1.5b
-
171% faster on qwen3:latest
-
Model-Dependent Performance Gap: The performance difference is more pronounced with the larger/more complex model (qwen3:latest), suggesting the RX 7900 handles larger models more efficiently
-
Consistency: The RX 7900 shows more consistent performance across tasks, with lower variance in latency
-
Total Execution Time:
- For deepseek-r1:1.5b: RX 7900 completed in 32.72s vs 107.53s (3.3x faster)
- For qwen3:latest: RX 7900 completed in 64.04s vs 204.98s (3.2x faster)
Comparison with Previous Results
Desktop PC (i9-9900k + RTX 2080, 8GB VRAM)
- deepseek-r1:1.5b: 143 tokens/s
- qwen3:latest: 63 tokens/s
M4 Mac (24GB Unified Memory)
- deepseek-r1:1.5b: 81 tokens/s
- qwen3:latest: Timeout issues (needed 120s timeout)
Performance Ranking
deepseek-r1:1.5b:
- AMD RX 7900: 197.01 tok/s ⭐
- RTX 2080 (CUDA): 143 tok/s
- Max+ 395: 110.52 tok/s
- M4 Mac: 81 tok/s
qwen3:latest:
- AMD RX 7900: 86.46 tok/s ⭐
- RTX 2080 (CUDA): 63 tok/s
- Max+ 395: 31.85 tok/s
- M4 Mac: Unable to complete within timeout
Cost-Benefit Analysis
System Pricing Context
- Framework Desktop with Max+ 395: ~$2,500
- AMD RX 7900: Available as standalone GPU (~$600-800 used, ~$900-1000 new)
Value Proposition
The AMD RX 7900 delivers:
- 1.78-2.71x better performance than the Max+ 395
- Significantly better price-to-performance ratio (~$800 vs $2,500)
- Dedicated GPU VRAM vs shared unified memory
- Better thermal management in desktop form factor
The $2,500 Framework Desktop investment could alternatively fund:
- AMD RX 7900 GPU
- High-performance desktop motherboard
- AMD Ryzen CPU
- 32-64GB DDR5 RAM
- Storage and cooling
- With budget remaining
Conclusions
-
Clear Performance Winner: The AMD RX 7900 is substantially faster than the Max+ 395 for LLM inference workloads
-
Value Analysis: The Framework Desktop's $2,500 price point doesn't provide competitive performance for LLM workloads compared to desktop alternatives
-
Use Case Consideration: The Framework Desktop offers portability and unified memory benefits, but if LLM performance is the primary concern, the RX 7900 desktop configuration is superior
-
ROCm Compatibility: Both systems successfully ran ROCm workloads, demonstrating AMD's growing ecosystem for AI/ML tasks
-
Recommendation: For users prioritizing LLM inference performance per dollar, a desktop workstation with an RX 7900 provides significantly better value than the Max+ 395 Framework Desktop
Technical Notes
- All tests used identical benchmark methodology with single concurrent requests
- Both systems were running similar ROCm configurations
- Network latency was negligible (local Ollama API)
- Results represent real-world single-user inference scenarios
Systems Information
Both systems are running:
- Operating System: Linux
- LLM Runtime: Ollama
- Acceleration: ROCm (AMD GPU compute)
- Python: 3.12.3