In part one, I described building Stalker: a mid-cap trading bot with factor rankings, a Claude analysis layer, deterministic risk checks, and a network of upstream data projects. The idea was that combining those pieces would produce something worth running. Paper trading would tell us whether it deserved real money.
The recorded \$1,000 strategy is worth \$855.23 as of the October 9 snapshot. It is down 14.48%, while the system's stored SPY price benchmark is up 8.02% over the same inception window. That is a 22.50 percentage point shortfall before operating costs.
I went back through the records to understand why. The most consequential finding was that the bot had spent much of the summer generating plans it could not execute. A losing-trade circuit breaker repeatedly rejected plans containing buys and could suppress exits bundled into those plans. Other safety checks were measuring the wrong account. The backtests and the supposedly controlled comparison also differed materially from the system actually trading.
This is an interim postmortem of that system. The original twelve-month experiment has not reached its planned May 2027 endpoint, and the evidence does not isolate the LLM as the cause of the losses. It does explain why I no longer regard the original validation claims as sufficient.
What the account actually recorded
For this review, I read all 117 performance snapshots through October 9, all 260 decision records and their archived plans, all 285 order records, and the 156 rows in the factors-only shadow book. I also checked the deployed configuration and read the paper brokerage's orders and positions. The trading configuration is still paper mode.
The performance module defines strategy value as the \$1,000 seed plus recorded realized and unrealized profit or loss. Its headline numbers are:
| Measure | May 1–October 9, 2026 |
|---|---|
| Recorded strategy value | \$855.23 |
| Recorded strategy return | −14.48% |
| Recorded realized P/L | −\$53.95 |
| Recorded unrealized P/L | −\$90.82 |
| Stored SPY price return | +8.02% |
| Stored IWM price return | −0.12% |
| Largest drawdown in the recorded strategy series | −22.40% |
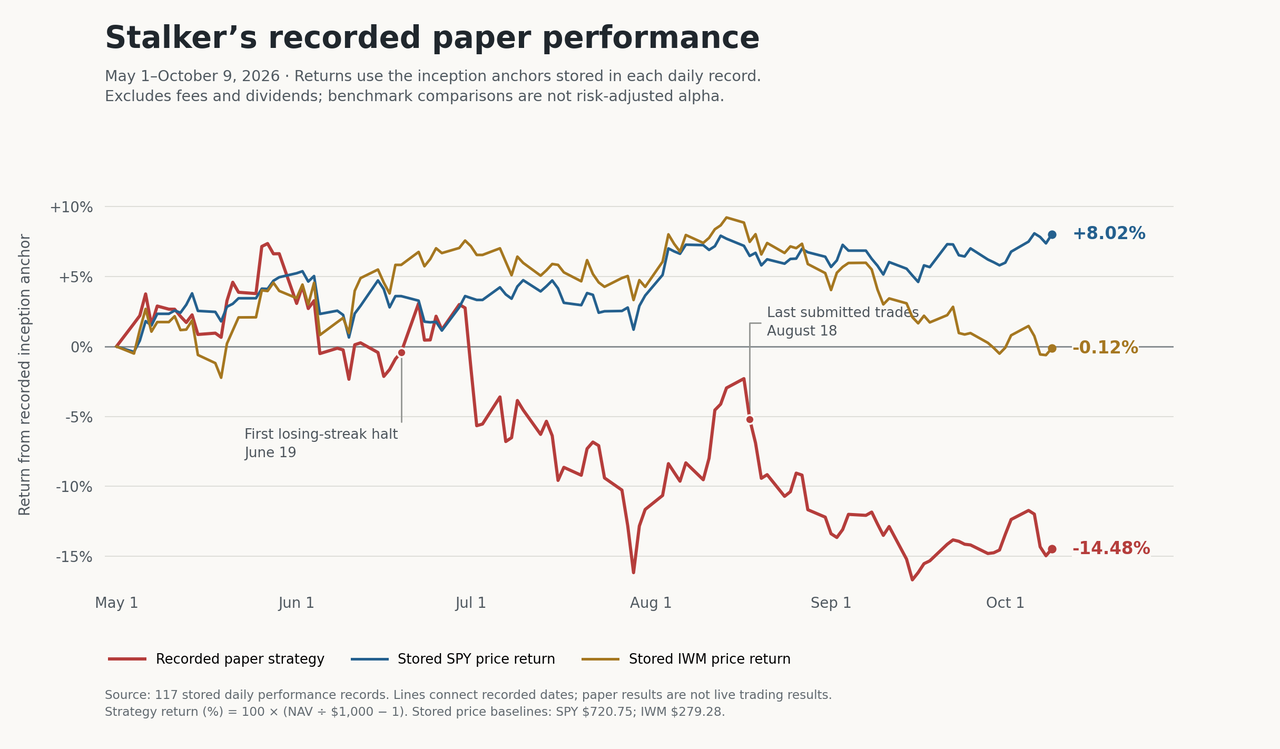
The daily observations behind this chart are available as CSV. These are the system's stored measurements. The benchmark lines are price changes, not dividend-reinvested total returns; the strategy line excludes infrastructure, data, and model costs. The return gap is simple subtraction, not a risk-adjusted estimate of alpha.
SPY is useful as an opportunity-cost comparison, but the benchmark set needs improvement. IWM tracks small companies; IJH tracks the S&P MidCap 400, a closer reference for the intended universe. A proper comparison would include a mid-cap total-return benchmark and consistent accounting for distributions. Alpaca's paper-trading documentation explicitly says the simulation omits dividends, regulatory fees, and several execution effects.
Even the two internal definitions of portfolio value need reconciliation. At the same position marks during this audit, seed plus filled-sale proceeds minus filled-purchase costs plus remaining positions produced \$849.85. The realized-plus-unrealized-P/L formula produced \$855.22. That \$5.37 difference is separate from prices moving between the snapshot and the audit.
The discrepancy traces to the recorded realized-P/L estimates failing to reconcile with purchase costs, sale proceeds, and remaining cost basis. For one fully closed position, VSAT, the fills imply a \$19.40 loss while the stored realized P/L shows a net \$14.19 loss. The sell accounting uses a snapshot of the broker's average entry price taken before submission; summing those estimates did not preserve the original total purchase cost. The historical curve above preserves the reported series rather than silently applying an unverified historical correction.
That discrepancy does not explain away the loss. It means the loss is being reported by an accounting system that still needs work.
The circuit breaker became a trading freeze
The clearest operational failure begins on June 19.
Stalker counts consecutive losing sells and stops new buys after three. The recent sequence included a loss on LQDA and two separate losing sells of VSAT. The counter measures sell orders, so multiple trims of one losing position can count as multiple losses.
The resulting rejection appeared 171 times through October 9:
| Month | Plans rejected by the losing-streak rule |
|---|---|
| June | 15 |
| July | 49 |
| August | 45 |
| September | 48 |
| October, through the 9th | 14 |
The last filled buy was submitted on June 18. After the halt began, the only approved plans containing trades were a VSAT sale on June 22 and two trims, MYRG and ENS, on August 18. There were no filled production orders submitted in July, September, or October through the cutoff.
The rule sounds reasonable when described as “stop buying after several losses.” Its implementation has a much broader effect. In risk.evaluate_plan, the presence of any buy activates the plan-level halt checks. If the losing streak is at least three, the function returns a rejected decision before processing individual orders.
That rejects the sells in a mixed plan too. A small, isolated reproduction confirms it: a \$50 sell paired with a \$50 buy is rejected during a three-loss streak; the same sell by itself is approved. The intended ability to reduce exposure survives only when the model happens to propose a sell-only plan.
The counter has no time-based expiration. It scans backward through recorded sells until it encounters one with nonnegative P/L. A successful sell can reset it; waiting a month cannot. The prompt also does not receive the active losing-streak state, so the model keeps proposing buys that the downstream gate cannot accept.
By October 9, the stored rationale was still discussing trimming weak holdings and recycling capital into better-ranked candidates. The risk result was still a losing-streak rejection. The count had reached six.
There is another observability problem here: the archived proposed_orders field contains the orders surviving the gate. On these plan-level rejections, both it and dropped_orders are empty. The original rejected proposals are not preserved. I can prove the mixed-plan failure in the code and count the 171 halt decisions; I cannot reconstruct how many individual sells those historical decisions suppressed.
This explains the inactivity. It does not tell us what returns those rejected trades would have earned. A halt might avoid bad purchases as well as prevent useful rebalancing. What the records establish is that we stopped getting the active strategy described in part one and largely carried the existing positions through the subsequent decline.
The other drawdown checks watched the wrong balance
Stalker operates a synthetic \$1,000 portfolio inside a much larger Alpaca paper account. The buy-sizing code builds a seeded account from actual filled cash flows. But the daily and high-water-mark drawdown checks read the full brokerage equity history.
Those are different denominators.
A \$50 loss is 5% of the intended strategy capital and roughly 0.05% of a \$100,000 paper account. At audit time, the full account stood approximately 0.23% below its one-year high. The recorded strategy ended 20.34% below its own high, after reaching a 22.40% maximum drawdown during the window. The nominal 15% portfolio drawdown halt was not evaluating the portfolio whose results I was reporting.
The combination is particularly unhelpful: a count-based rule can freeze buys indefinitely, while the percentage-based rule barely notices losses at the strategy's scale. Neither check automatically liquidates existing positions. The presence of a module called risk.py is not evidence that the resulting portfolio behaves as intended.
Part one already disclosed the earlier cash bug, where repeatedly capping the big paper account's cash at \$1,000 effectively replenished the strategy's spending allowance. That early over-deployment also means the full recorded history is not a clean, unlevered \$1,000 experiment. The ledger fix addressed the replenishment. It did not make every other account-dependent calculation consistent. The experiment needed one shared definition of cash, equity, realized profit, and drawdown throughout the trading path.
The backtest validated a smaller piece of the system
I was too confident in part one's statement that the factor stack had been validated end-to-end on bias-corrected backtests.
The engine is explicit about its scope: it tests factor ranking and deterministic selection. The usual configuration holds 30 names at equal weights and rebalances weekly. The deployed bot asks Claude for a smaller portfolio, incorporates macro tilts and other signals, offers advisory sizing, responds to incoming briefs, and then subjects the proposals to additional gates.
A good result for the first system does not validate the second.
There was configuration drift even within the historical tests. The file named configs/production.json omits the quality-definition setting. The engine therefore defaults to ROE plus gross margin, while the deployed scorer uses ROIC plus operating margin. A filename saying “production” was doing more reassuring than the configuration deserved.
The historical universe also remains imperfect. Its bootstrap starts from currently active companies in a broad market-cap band and adds delisted companies. That improves on using today's shortlist, but can still miss former mid-caps that remain listed and have moved outside the starting band. One of the strongest archived ROIC runs even ends with foreign listing symbols, including 0LPE.L, 0YY7.L, and SSRM.TO. It did not reproduce the live system's exact exchange, liquidity, and Alpaca-tradability restrictions.
Then there is the tuning. The run directory contains 46 ordinary strategy results on the same January 2023–April 2026 window. We compared factor weights, quality definitions, momentum variants, and execution assumptions. Processing each historical date in order does not turn the choice of a winning configuration on that same history into an independent test.
For example, the archived equal-factor baseline returned 52.69% against an 88.71% SPY price gain. The selected configuration with 55% momentum weight and the old quality definition returned 110.28%, creating the familiar 21.57 percentage point advantage. Those are useful research observations. They are not an established forward edge.
Part one also described rejecting a spectacular Kelly-sizing result after a sensitivity check exposed a cash-allocation artifact. That was the right rejection. I should have applied the same skepticism to the surrounding claims before treating the assembled strategy as validated.
These defects do not quantify how much of the paper loss came from stock selection. They explain why the backtest should never have carried so much weight in our expectations.
The factors-only book lost more, and the comparison still cannot answer the AI question
Removing Claude is not an evidence-backed cure from these records. The deterministic shadow book also performed badly.
Its actual recorded inception is May 6. Comparing both arms from that date through October 9 gives:
| Recorded series | Return over the matched window |
|---|---|
| Brief-driven paper strategy | −17.58% |
| Factors-only shadow book | −29.80% |
The brief-driven return here differs from the opening figure because it starts at the May 6 value of \$1,037.63, not the original \$1,000 seed.
It would be convenient to interpret the smaller loss as evidence that Claude helped. The comparison cannot support that conclusion because the two arms differ in more than their selection signal.
The shadow book rebalances daily at equal weights; the paper strategy trades when briefs arrive and uses different sizing. The shadow implements an earnings veto, but not the paper strategy's losing-streak, drawdown, or wash-sale gates. While the paper strategy was largely frozen, the control continued trading.
The shadow prices have a separate problem. Its supposed daily closing marks and fills come from the price field in the universe snapshot. That field originates in the overnight screener, and the evening archive copies it without fetching a fresh close. If a held name disappears from the available price map, the shadow code sells it at its average entry price, manufacturing a break-even exit instead of obtaining an actual executable price.
I have not measured the direction or size of the distortion from each defect. Together they are enough to invalidate an LLM-only interpretation of the return gap.
The original preregistration was a useful intention: specify the comparison and decision rule before declaring a winner. The implementation did not preserve the required parity. Waiting until May 2027 will not repair that by itself. A repaired experiment needs matching accounting, marks, execution assumptions, sizing, and risk controls, with the intended difference stated explicitly and a new evaluation window.
The API bill was not the main problem
Part one estimated \$200–700 a year for the LLM layer. That estimate should not be mistaken for a measured bill.
The 253 non-test decision records contain about 2.67 million ordinary input tokens, 200,000 output tokens, and 16,304 cache-write tokens. At Anthropic's listed Sonnet 4.6 prices, those recorded calls represent roughly \$11 in analysis inference, including the small cache-write component. This is an estimate from stored usage, not an invoice reconciliation; it excludes unrecorded failures, upstream producers, data subscriptions, and AWS.
About \$7.52 of that estimated ordinary-token cost belongs to the 171 streak-rejected plans. The wasted money is modest. The more consequential waste is repeatedly doing analysis that the execution policy cannot use.
Costs still matter to the original proposition. On a \$1,000 account, each \$10 of annual operating expense requires another percentage point of return just to cover itself. A hypothetical five-percentage-point annual edge yields only \$50 before costs. The full network would need a defensible cost allocation, especially where upstream projects serve other purposes too.
But the observed strategy was already losing before those costs. Blaming an expensive model subscription would miss the larger failure.
What I would require before trusting another version
The repair starts with the experiment and the accounting.
First, one reconciled ledger should define the strategy's cash, positions, equity, and drawdowns. It should agree with broker fills and remaining cost basis, with any difference surfaced explicitly. A paper account funded at the intended scale would also remove much of the need to emulate a smaller account inside a larger one.
Second, halts need explicit recovery behavior. Disallowed buys should be filtered without automatically suppressing valid risk-reducing sells. The analysis prompt should receive the active restrictions. Every raw proposal, rejection reason, surviving order, submission, and fill should remain available for review. A halt continuing for weeks should be an operational condition someone sees, not background noise in otherwise successful daily reports.
Third, the deterministic baseline needs its own credible forward result under the same investable universe and execution rules. The shadow book needs real timestamped marks, real handling of universe exits, and the same constraints as the strategy it is meant to control for. Only then does adding one AI decision layer at a time produce an interpretable experiment.
Finally, the earlier post's confidence needs to be revised. The architecture successfully moved data between services and generated trades. That is valuable engineering work. The records do not establish an investment edge, an incremental contribution from the LLM, or a profitable operating model.
The strongest explanation for Stalker's disappointment is the combination of losses in the held portfolio, a control loop that largely stopped rebalancing, and validation that overstated what had actually been tested. We can identify those failures without claiming to know the return of a corrected bot.
That is what the paper experiment was supposed to uncover before real money entered the picture. The useful next step is to make the experiment trustworthy enough that its next result means what we think it means.
Audit notes
The cutoff is the October 9, 2026 performance snapshot. Source reads were performed that evening in Central time, after midnight October 10 UTC. The review used paginated DynamoDB reads, the corresponding archived plan JSON, read-only paper-brokerage requests, deployed Lambda configuration, and repository revision 2e4a994. No trading configuration was changed for this review.
The main code paths are src/stalker/risk.py for plan rejection, src/stalker/analyze.py for seeded cash and drawdown inputs, src/stalker/performance.py for the reported curve, src/stalker/shadow_book.py and scripts/shadow_book_tick.py for the control portfolio, and src/stalker/backtest/engine.py for historical simulations. The 260 decisions include seven test sends; the 285 order rows include tests, canceled orders, and rejected plans, not 285 executed trades. There were 153 filled production order rows. The downloadable CSV contains aggregate performance observations, without account identifiers or archived model prompts.